
Automations: Scenarios
Scenarios
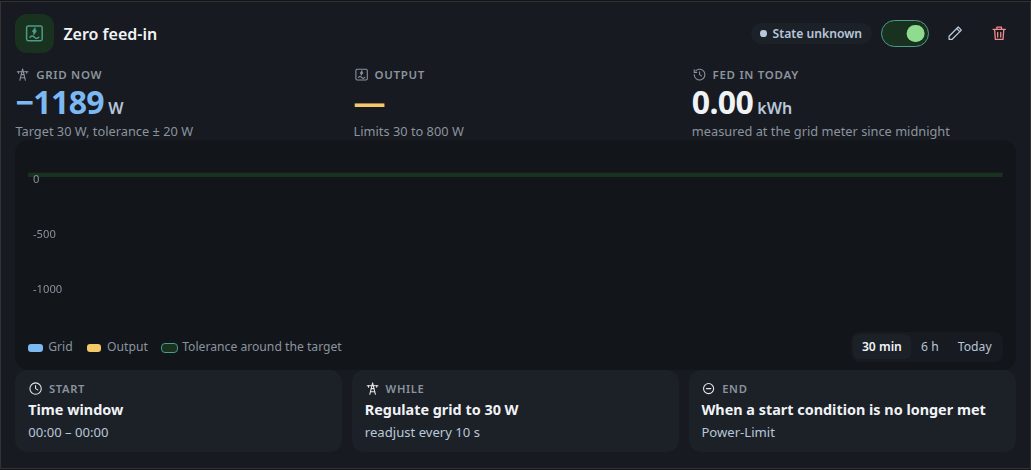
A scenario has three phases. Start holds the conditions that begin it, While is what happens during the scenario, and End holds the actions that run when it stops. The usual use is a regulator that keeps the grid balance near a target by adjusting one output, for example an inverter.
The scenario card
A collapsed card shows the scenario icon, its name, a short status line, a status pill and an on/off switch. While the start conditions are not yet met, a thin bar under the name shows how close the first balance threshold is to its limit, with the current value and the limit in W.
A click on the card expands it. The icon tile collapses it again, outside the editor a click on the name does the same. Expanding the card shows the figures, the chart and the phase bar. The status pill shows the current state of the scenario:
| Pill | Meaning |
|---|---|
| Off | The scenario is switched off. |
| Waiting | At least one start condition is not met yet. |
| Ready | All start conditions are met and the hold time runs. The line below tells how long until the start. |
| Running since (time) | The start conditions hold and the scenario is active. |
| Regulating since (time) | The scenario regulates the grid to its target. |
| Fallback value | The regulator cannot calculate and sends its fallback value. The line below names the reason, either a stale balance or a missing measurement. |
| Service offline | The automation service does not answer. |
| State unknown | The service has not reported this scenario yet. |
For a regulating scenario the card shows three figures. Grid now is the current grid balance against the target, with the tolerance band around it. Output is the value the regulator sends, with its minimum and maximum. Fed in today is the energy measured at the grid meter since midnight.
The chart plots the grid balance and the output over the selected period. The periods are 30 min, 6 h and Today, which starts at midnight. The shaded band marks the tolerance around the target. The grid and output series come from the history kept in this browser, which the history recorder fills, and the chart adds the newest values while the page is open. The dashboard also samples these two series on the server once a minute for the history exchange with other devices. The chart on this page does not read that buffer.
The phase bar shows Start, While and End side by side, each with its condition or action in short text. The phase that is running is highlighted. The While phase is highlighted while the scenario runs or falls back, and the End phase for one minute after it has stopped.
Editing a scenario
The pencil button on an expanded card opens the editor. It has three phases.
- Start lists the start conditions and the actions that run at the start. Each phase takes the same condition and action rows as a single rule.
- While selects what happens during the scenario: Regulate, Hold or Nothing. Changing the mode discards the content of the previous mode.
- End runs the end actions. With Own end condition switched off, the scenario ends as soon as its start conditions are no longer met. With the switch on, its own conditions decide when it ends.
Two more fields sit in the End phase. Run at least keeps the scenario running for this many minutes, even if its end condition is met sooner. Switching the scenario off and the maximum run time still end it at once. Empty means no minimum. Pause after the end blocks a new start for this many minutes after the scenario has ended, even if its start conditions hold again. Empty means no pause.
For Regulate the form asks for the following values. Each field has a help text next to it.
- Target in W, the grid balance to hold, positive for import and negative for export.
- Deadband in W, the range around the target where the output stays unchanged.
- Output, the device output the regulator writes to.
- Direction, either Throttle inverter or Follow consumer.
- Measured value, which can be a Device meter, the Balance or the Last value.
A band preview under the target shows the tolerance band and the current grid balance. It states whether the grid is inside or outside the band, or that the grid value is not known yet.
Under Fine tuning you find Gain, Minimum in W, Maximum in W, Step size in W, Max. change per step in W, Interval in s and Fallback value. An empty interval uses the regulator interval from the settings (see Settings).
Each fine tuning field shows its default as a grey placeholder. A default is not saved, so the field stays empty and keeps following the default. A stepper on an empty field starts from the default.
For Hold the phase sends its actions again every Repeat every (s) seconds, 60 by default, while the scenario is active.
Record history at the bottom of the editor stores the scenario’s own history, as for single rules.
The start phase needs at least one condition, and each phase takes at most 8 conditions or actions. The dashboard checks the scenario before saving and names the problem in a message. Examples are a regulator without an output, an output that another scenario already uses, a minimum above the maximum, a gain outside 0.1 to 1, an inverter without a fallback value, or a repeat that is shorter than the minimum interval for commands.