
What’s new
The highlights of every Energy Node release since v0.8.0. Read them before an update, or look up since when something is there. The full list of changes is in the changelog of each component.
Next release not released yet
The history can now be shown below the timeline as a detailed history. Details and test runs can be traced there as well
- Detailed history The history can now be shown below the timeline as a detailed history. Details and test runs can be traced there as well.
3 more changes in Next release
v0.11.0 5 Nov 2026
The installer diagnose shows a live log of the dashboard and the updater
The Live log card in the diagnostics follows the dashboard and the updater, so you can find out without SSH why the dashboard does not start. Under “Lines in report” you choose how many lines the report takes along. “Copy for issue” copies it for a GitHub issue, with addresses, names and passwords masked.
The installer's Dashboard step presets users, guest access and the look
The Dashboard step sits between Configuration and Run. There you preset users, guest access and the look, or choose “Configure later”. The dashboard takes the presets over at its first start, and the setup checklist then shows them as “Set in the installer”.
More in Deploying a node
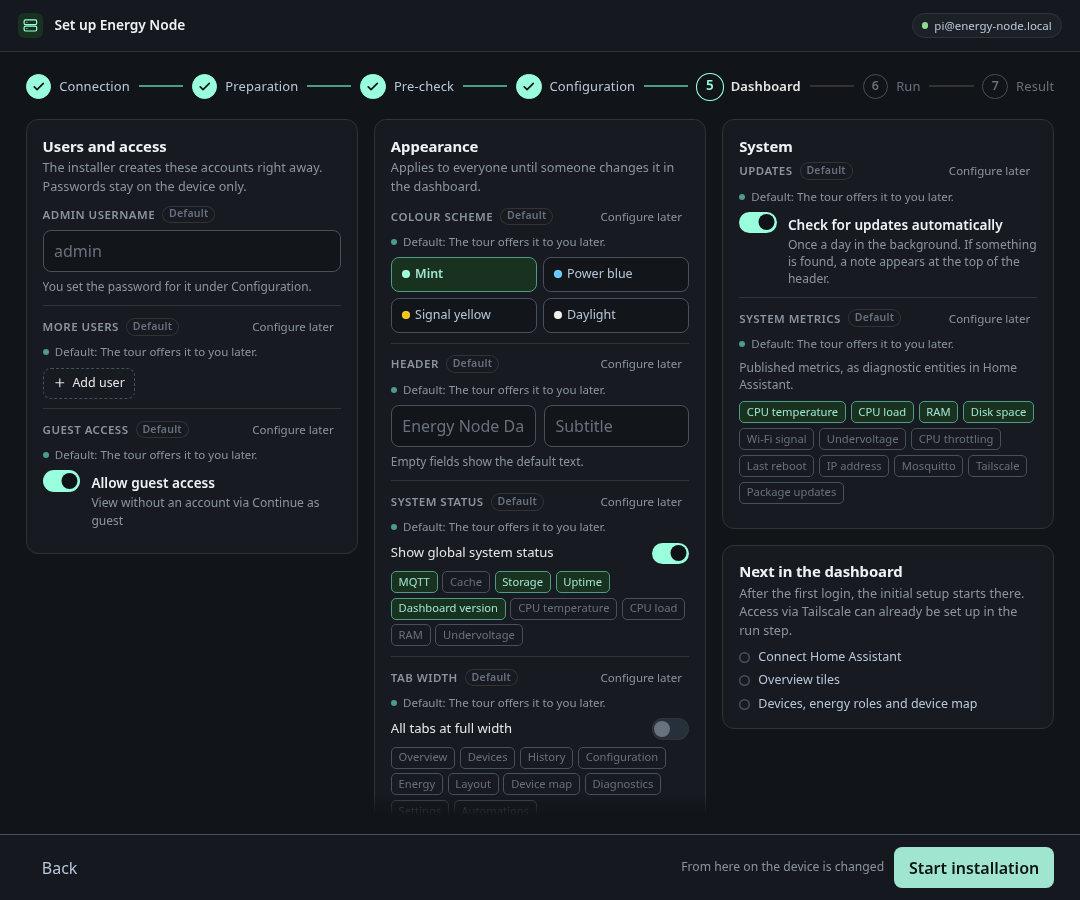
A dialog asks for the sudo password and sets up passwordless sudo
If you connect with a key file and sudo on the device asks for a password, the pre-check opens the dialog “sudo password needed”. With “Allow sudo” the installer sets up passwordless sudo for your user. The password is not stored and appears in no log.
More in Deploying a node
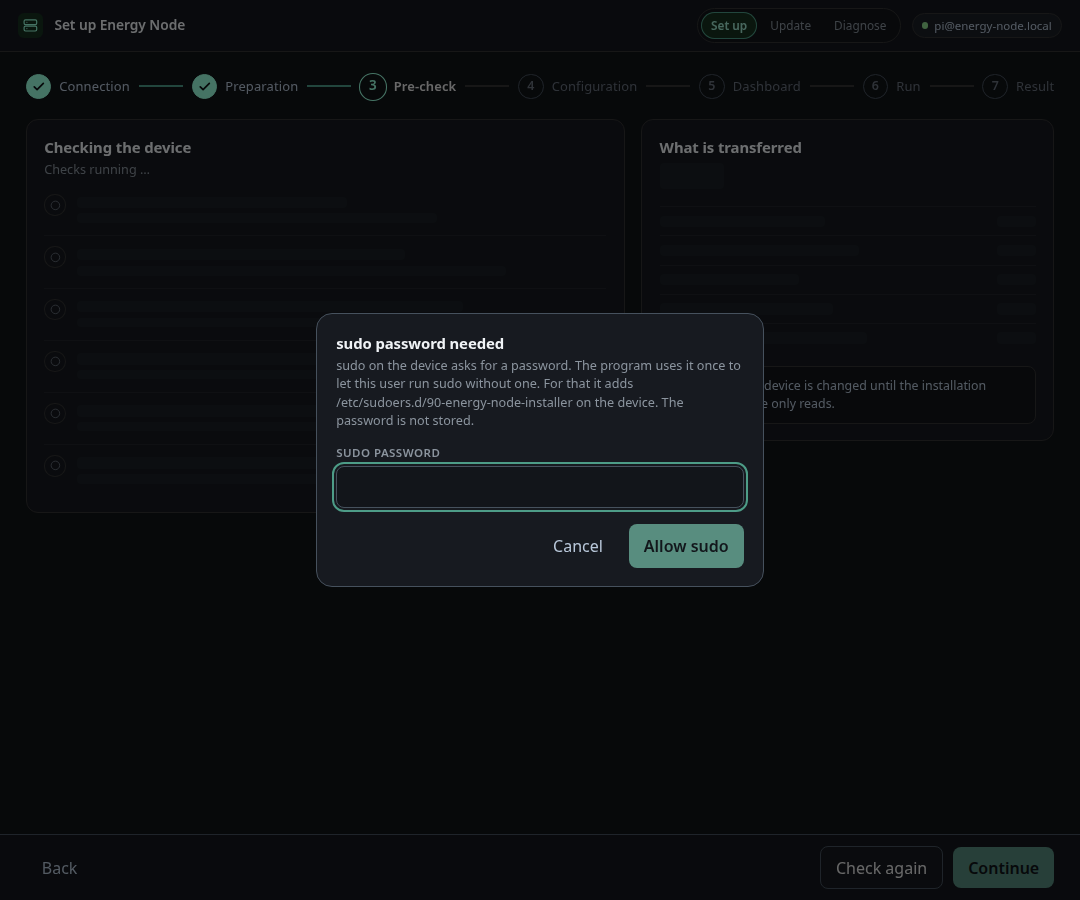
The statistics page works on a phone, with a table or grid view
On narrow screens the statistics page shows a table of intervals or a grid, and the period sits in a pill at the bottom.
More in Energy statistics
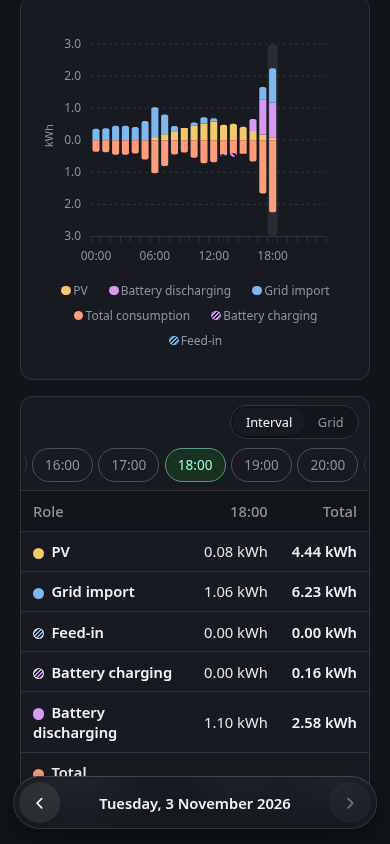
Star favourites and an Analysis tab that lists warnings and every entity
The Analysis tab lists the warnings and every entity of the device with its topic, its last message and the commands sent to it. It needs the right to see the device analysis, and choosing favourites needs the right to style devices.
More in Device dialog
Install the offered update from the update bar
When a newer release is out, the bar under the header offers it. Install now asks once more and then updates right away. Prepare installation opens the installer page.
More in Settings: Versions & updates
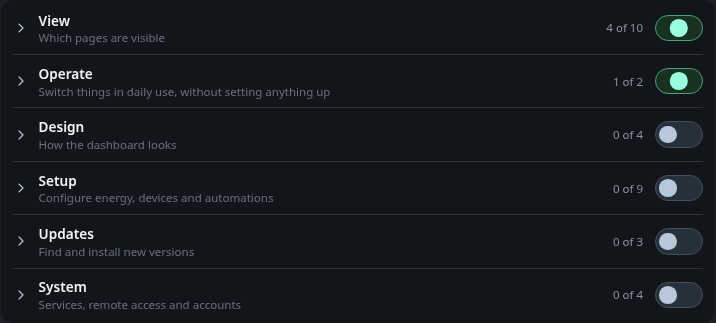
Users only see and change the pages their permissions allow
You set permissions under Settings, Users. The settings permission is now split into “Change the appearance” and “Set up the dashboard”. Existing accounts keep what they were allowed to do. An account without a view permission sees only a notice and its own account.
More in Settings: Users
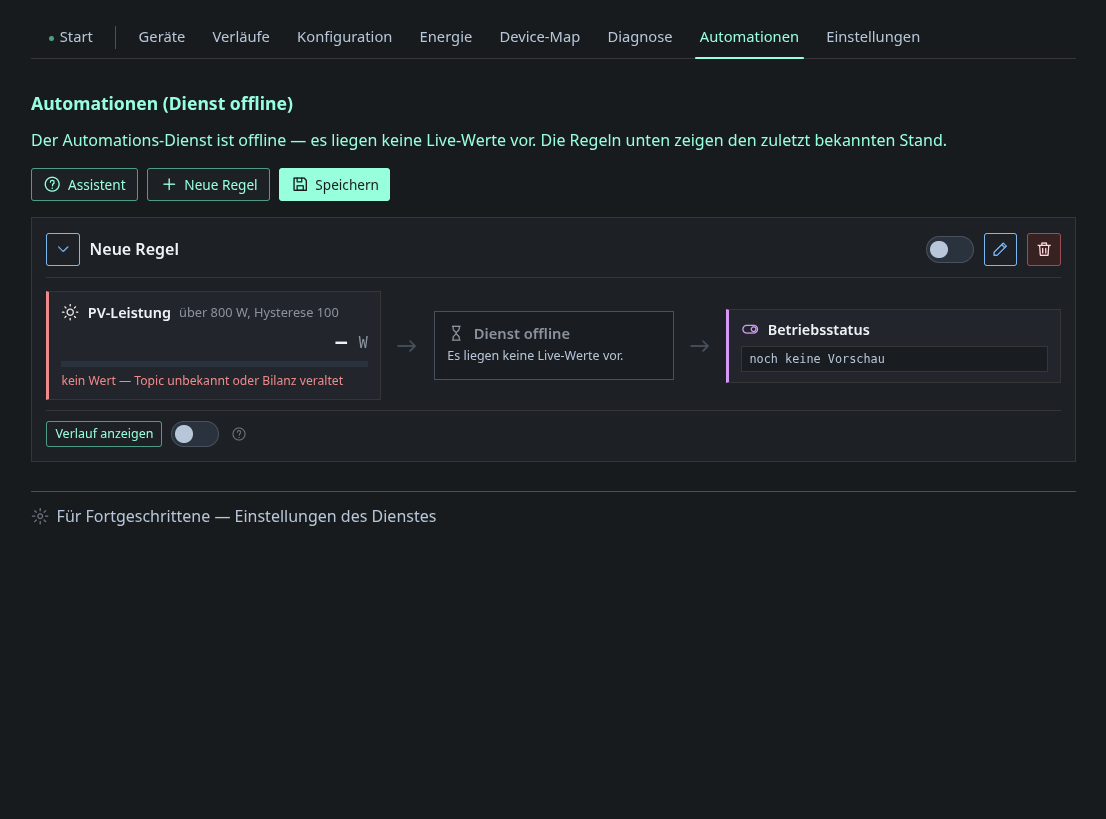
Scenarios with live cards, charts and a phase editor, plus a new rule editor
A scenario has three phases. Start holds the conditions that begin it, While is what happens during the scenario and End holds the actions when it stops. The usual use is a regulator that keeps the grid balance near a target.
More in Automations: Scenarios
Every feature since v0.8.0 has a tour, and older releases can catch up
Every visible feature since version 0.8.0 has a tour. Releases older than the last three minor versions open step by step under Explore further back. On every older release card, Take the tour plays all tours of that release. Once all are seen, the button reads Repeat tour.
The checklist's Explore mode lists the highlights of the last three releases
Under Settings, Checklist you find the Explore mode. It lists the highlights of the last three minor versions, one card per release. Highlights with a tour walk you through the change on the real pages, the others show their description.
Calibration and tuning notes follow the dashboard language
The notes under Calibration and tuning now appear in the language of the dashboard, before they always came in German. Home Assistant shows them in its own language.
The installer detects a refused MQTT login and repairs it with a new password
If the broker rejects the password, the diagnostics show the MQTT login check as failed. The repair opens the dialog “Set a new MQTT password”, where you enter a new password or create one with “Random password”. The node and the broker then both receive it.
Skip recommended apt packages and clean the package cache
The installer no longer loads recommended extra packages. That keeps about 400 MB of compilers the device does not need off it. After the apt steps it deletes the downloaded package files, so small SD cards do not fill up.
The installer can load Python packages online when the versions do not match
If the device's Python version does not match the package, the preparation stops with “Process paused, confirmation required”. With “Load dependencies online” the installer loads the remaining dependencies from the internet. The device needs internet access for this.
More in Deploying a node
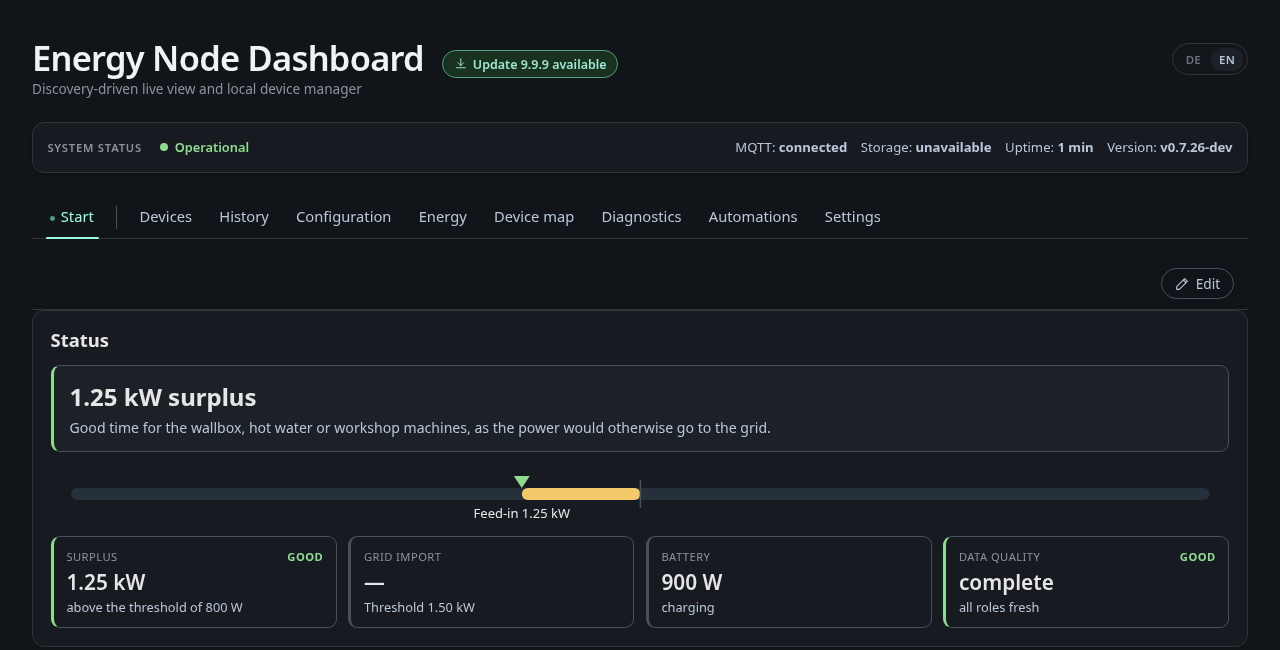
A guided first-time setup for admins covers access, display, system and devices
As an admin, a bar at the bottom walks you through the real settings pages, and a spotlight marks the setting of each step. What an existing install already has set is checked off, and you can put off any step with “Later”. Anything still open is in the checklist afterwards. Guests see a note until the setup is finished.
Redesign the login card and link the favicon
The sign-in card has a new design. A bug with the favicon is also fixed.
Guests can only view by default, and an admin can switch guest access off
Guests may only view by default. An admin can switch guest access off in the guest card of user management. The sign-in page then no longer offers guest access, and running guest sessions end.
More in Settings: Users
Redesign the toast with glass, timer line and swipe to dismiss
The line at the bottom shows how long a toast stays. While the pointer rests on it, the time stops. Swiping right closes the toast. Every message disappears on its own, warnings and critical messages stay longer.
Automation windows can be limited to days of the month
In the editor, time and sun windows have the collapsible section “Advanced: days of the month”. There you pick days from 1 to 31. The day the window starts counts, as with the weekdays.
Home Assistant users sign in through the Energy Node Companion
Under Settings, Users you create a pairing code in the Home Assistant section. You enter it in Home Assistant under Settings, Devices and services, Energy Node Companion, Configure. After that the panel in Home Assistant shows the dashboard as the signed-in Home Assistant user. You set their rights through the presets HA administrators and HA users.
More in Settings: Users
The zero feed template sets the regulator target with a draggable band
The template asks “How tight should it regulate?”. You move the window by dragging, tapping or with the arrow keys, or you pick one of the cards Tight, Balanced and Careful. With “Adjust tolerance” you also drag the width of the band. The bars show yesterday's spread of the grid power, moved to the new target.
Rules show their last four triggers, and phones open the assistant as a sheet
When you open a rule on the Automations page, a strip shows its last four triggers. On a phone the assistant opens as a sheet at the bottom that you drag down to close.
Named accounts with own permissions, a minimum password length and sessions
Home Assistant users sign in through the Energy Node Companion integration. From version 0.4.0 it pairs with the dashboard through a pairing code from the Home Assistant card on the Users page. The guide links to the integration on GitHub.
An assistant builds scenarios and rules from five templates like zero feed-in
You open it on the Automations page with “Assistant”. It shows the templates that fit your devices and names the missing device for the others. “Without a template” creates an empty rule or scenario.
Automation rules can repeat their actions while their conditions hold
The rule editor has the field “Repeat every (s)” for this. While all conditions hold, the rule sends its actions again at this interval. 0 means once per trigger. Repeat does not work with a toggle action.
Onboarding bar, spotlight and checklist
- Set up and explore From now on the checklist shows what there is to discover after every update. It also offers a first setup, which you can still do later.
- Guided tours A guided tour like this one shows you where to find the new features.
- Catch up on tours You can also catch up on older tours if you want to discover what you might have missed.
8 more changes in v0.11.0
- Apply the installer admin name and detect more setup steps as done Dashboard, Bootstrap, Installer, Installer web UI · #202
- Tours can run actions, include guest and favourite steps, and offer news Dashboard · #201
- Log restricted logins and reject password changes of HA accounts Dashboard · #200
- The dashboard starts and stays reachable when the first MQTT connection fails Dashboard · #195
- A fresh install starts the dashboard despite a missing folder or MQTT login Bootstrap, Installer · #191
- The main tab's More list no longer keeps resizing itself Dashboard · #181
- New assistant templates for heat pumps, low tariff charging and §14a control Dashboard, Automation · #172
- Editors show devices as tiles with live values in one device picker Dashboard · #165
v0.10.8 22 Oct 2026
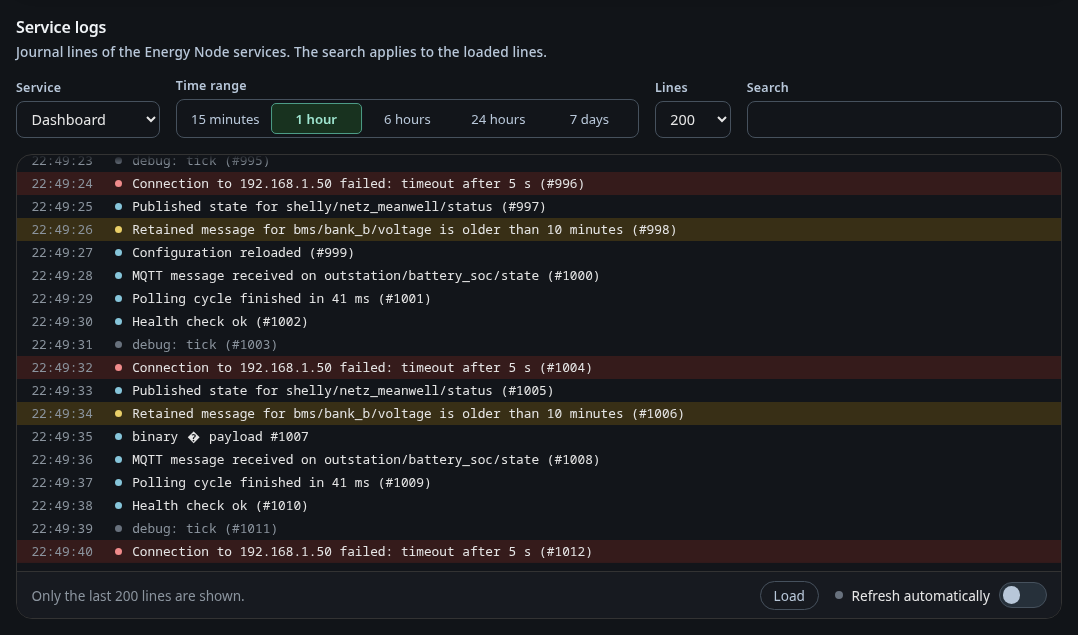
The diagnostics page shows Energy Node service logs with search and refresh
The Service logs section on the diagnostics page shows the journal of one service at a time. Choose the service, the time range and the number of lines, search the loaded lines and turn on Refresh automatically to see new lines every 5 seconds. It needs the system_actions role.
More in Diagnostics
The dashboard title and subtitle can be changed or hidden
The Masthead card on the Appearance page sets the title and subtitle at the top of every page. An empty field keeps the default text, and each line can be hidden. The title also names the browser tab and the sign-in page.
More in Settings: Appearance
Settings pages are listed in a sidebar, on phones in a sheet from the bottom
The settings pages sit in a sidebar, each with an icon and a short description. On a phone a button above the content shows the current page and opens the full list as a sheet from the bottom.
More in Settings
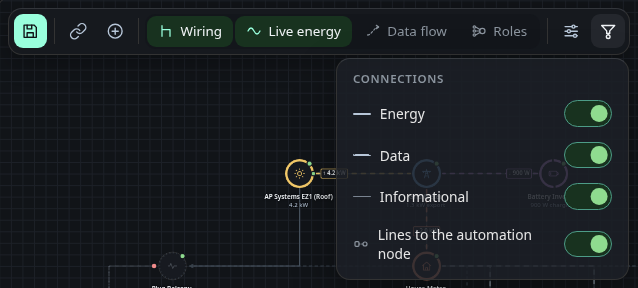
The device map can hide connections by type (energy, data, info) with a new filter button
The filter button next to the display menu hides energy, data or informational connections and the lines to the automation node, with one switch per type. It only changes what this browser draws.
More in Device map
2 more changes in v0.10.8
v0.10.0 19 Oct 2026
Single appliances on a meter can be named as sub-devices in the device map
Name single appliances on a meter as sub-devices. They appear in the device map, in the device dialog and on the energy page, so a washing machine behind a plug gets its own place.
More in Device map
Switches are an energy role with an optional channel, shown as green or red
A switch is now an energy role with an optional channel. Every switched connection shows a green or red circle, and only the connection on a switched off channel is cut. The channel of a connection is chosen in its card.
More in Device map
The device map shows switched-off devices, which fade out with an off label
The device map marks every device without power as off and fades it out. A switched off output cuts the connection behind it.
More in Device map
House load is always calculated, with a house meter as cross-check
House consumption is now always calculated from the balance. A house meter serves as a cross check and replaces the calculation only when no grid role is assigned. A line below the modes shows where the value comes from and how far the meter deviates.
More in Energy
Home Assistant gets sensors for wallbox, heat pump and custom categories
Additional sensors offers House load measured, House load calculated and one sensor per wallbox, heat pump and custom category. All are on by default. Deselect one and the dashboard removes it from Home Assistant, select it again to bring it back.
More in Settings: MQTT
The history page offers fitting resolutions in a dropdown and a 3 month preset
The first pill above the chart lists the resolutions that fit the chosen span and shows how much of it each one covers. The automatic choice is the coarsest resolution that has data. A week or longer shows hourly values from the energy statistics, and there is a quick choice for 3 months.
More in History
The MQTT tab explains the Mosquitto bridge and picks system metrics in one list
System metrics such as Wi-Fi signal or undervoltage are published as diagnostic entities. Remove a metric from the selection to stop publishing it and add it again to resume. Changes are saved at once and need a login with configuration rights over HTTPS.
More in Settings: MQTT
Choose how many changelog versions show, kept on the device across updates
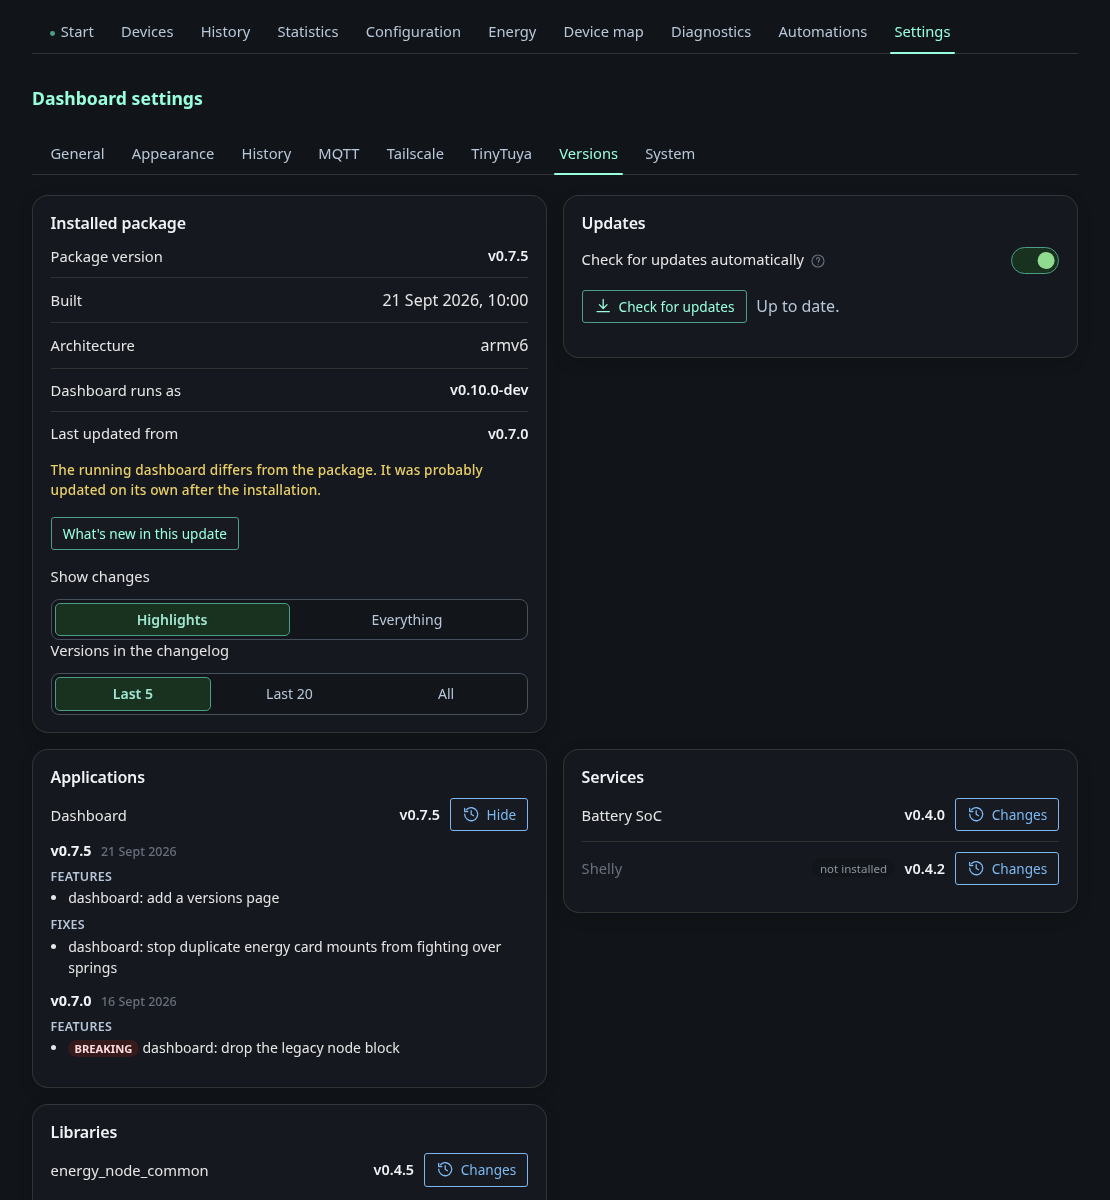
The setting Versions in the changelog sits on the Versions tab. Last 5 is the default and Last 20 is the most a bundle carries. All also shows the older versions the node kept from earlier updates.
More in Settings: Versions & updates
Release highlights also come in German, shown in the dashboard and installer
Release highlights carry a German text next to the English one. The dashboard shows the text in its language, and so do the installer and the release notes on GitHub.
More in Settings: Versions & updates
Energy statistics tile, page and recording mode
The Statistics tab shows consumption, PV yield, grid import, feed-in and the battery flows for a day, week, month or year. The node records the hours itself, and with the companion the hours from Home Assistant replace them. A tile with the same figures is available for the overview.
More in Energy statistics
10 more changes in v0.10.0
- Expandable highlight details in the what's new dialog Dashboard · #152
- Options for the energy statistics card Dashboard · #151
- Settings in card layout and aligned panel headings Dashboard · #150
- The device map shows the right edge of its canvas again Dashboard · #149
- Hide only role-less entries and share the list with the device map Dashboard · #147
- Help texts, device map, energy roles and statistics fit narrow screens Dashboard, Installer web UI · #144
- Device tiles update live without reloading Dashboard · #135
- The statistics tile updates live in place Dashboard · #133
- The update result screen fits the dashboard Installer web UI · #131
- Hourly energy statistics from Home Assistant via the companion Dashboard · #130
v0.9.8 12 Oct 2026
The balance node is merged into the energy_node device
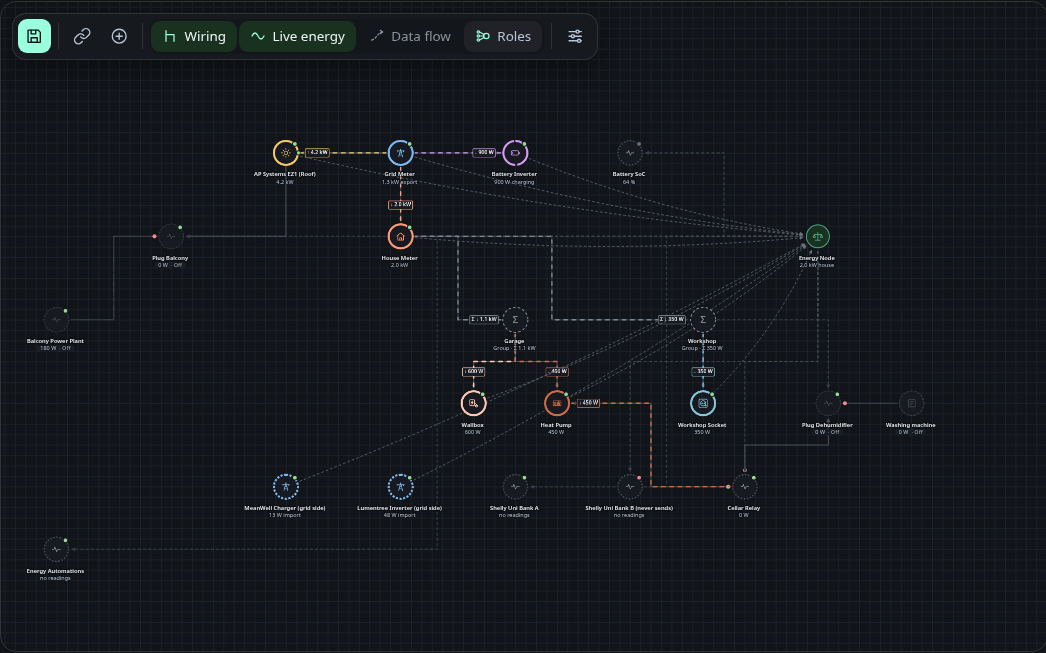
The Energy Node is the balance itself, the device the dashboard publishes for Home Assistant. It shows the net grid power, and the Roles layer connects every device with an energy role to it.
More in Device map
Show exchange and history status as tiles
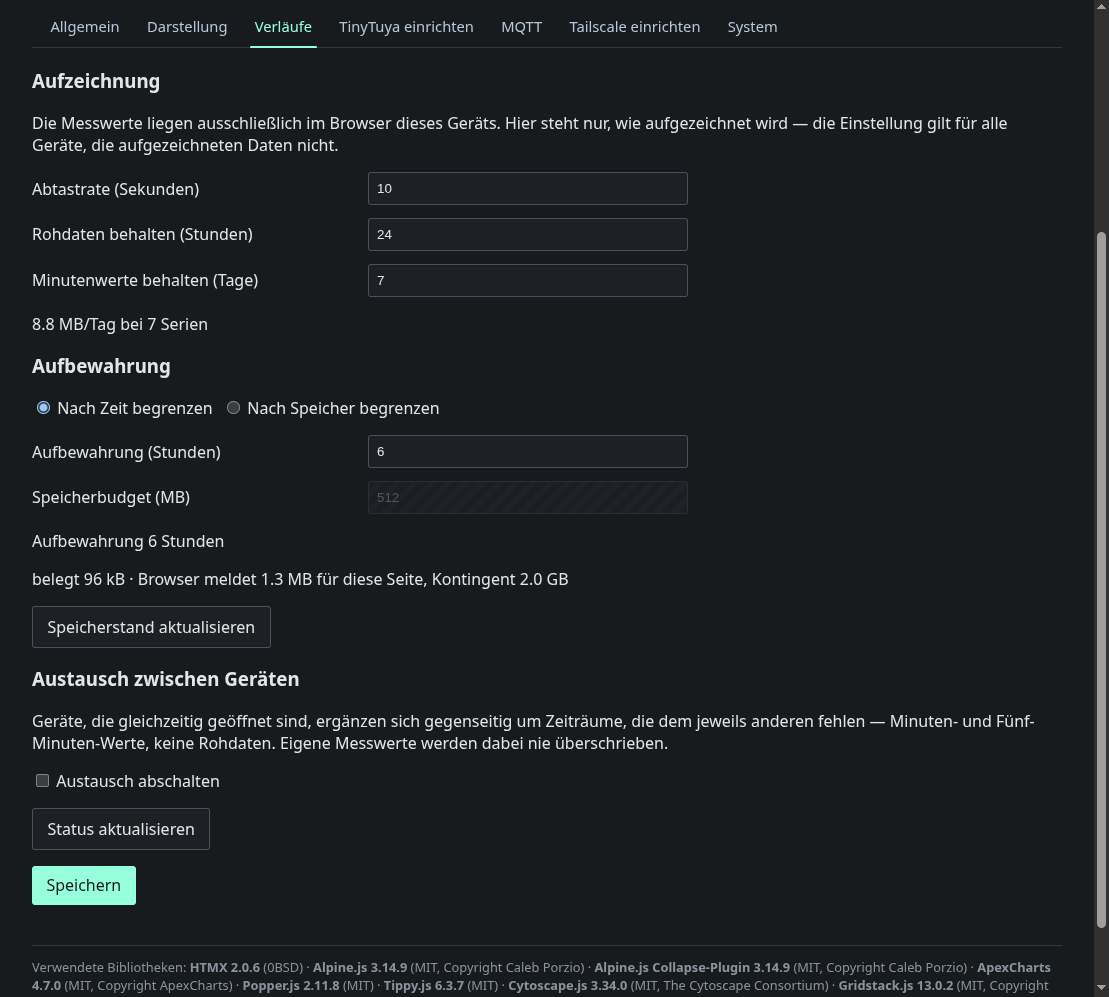
The History page of the settings switches the exchange between devices and chooses when this browser exchanges. Below the choices a status tile shows whether the exchange is connected and how many values it added.
More in Settings: History
7 more changes in v0.9.8
- Connections show their flow direction and can be reversed by hand Dashboard · #129
- Hourly energy statistics recorded on the server Dashboard · #128
- The automation device sits under the node, with its rules linked to it Dashboard, Automation · #127
- Exchange history only on demand Dashboard · #124
- Show update progress and what's new after an update Dashboard, Installer · #123
- List every step and service as its own run station Installer web UI · #121
- Serve the automation history in full Dashboard · #119
v0.9.0 10 Oct 2026
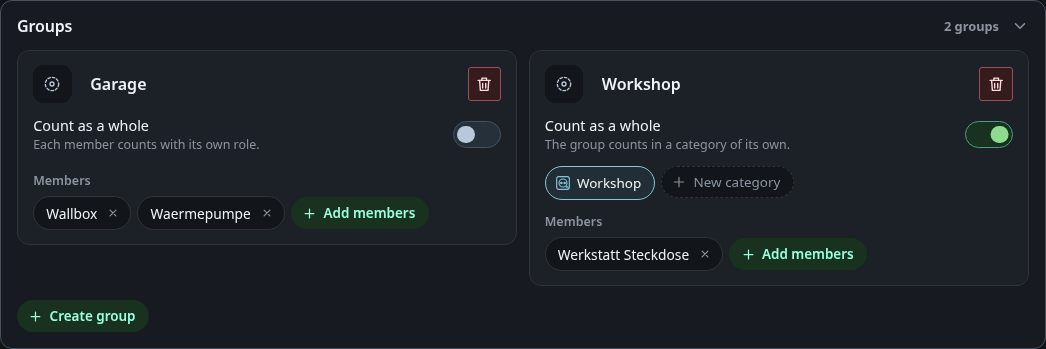
Energy groups and custom categories
A group bundles devices without a meter of their own. With Count as a whole on, it counts in one consumer category, which you pick or create in place. Custom categories add your own consumer, producer or storage types.
More in Energy
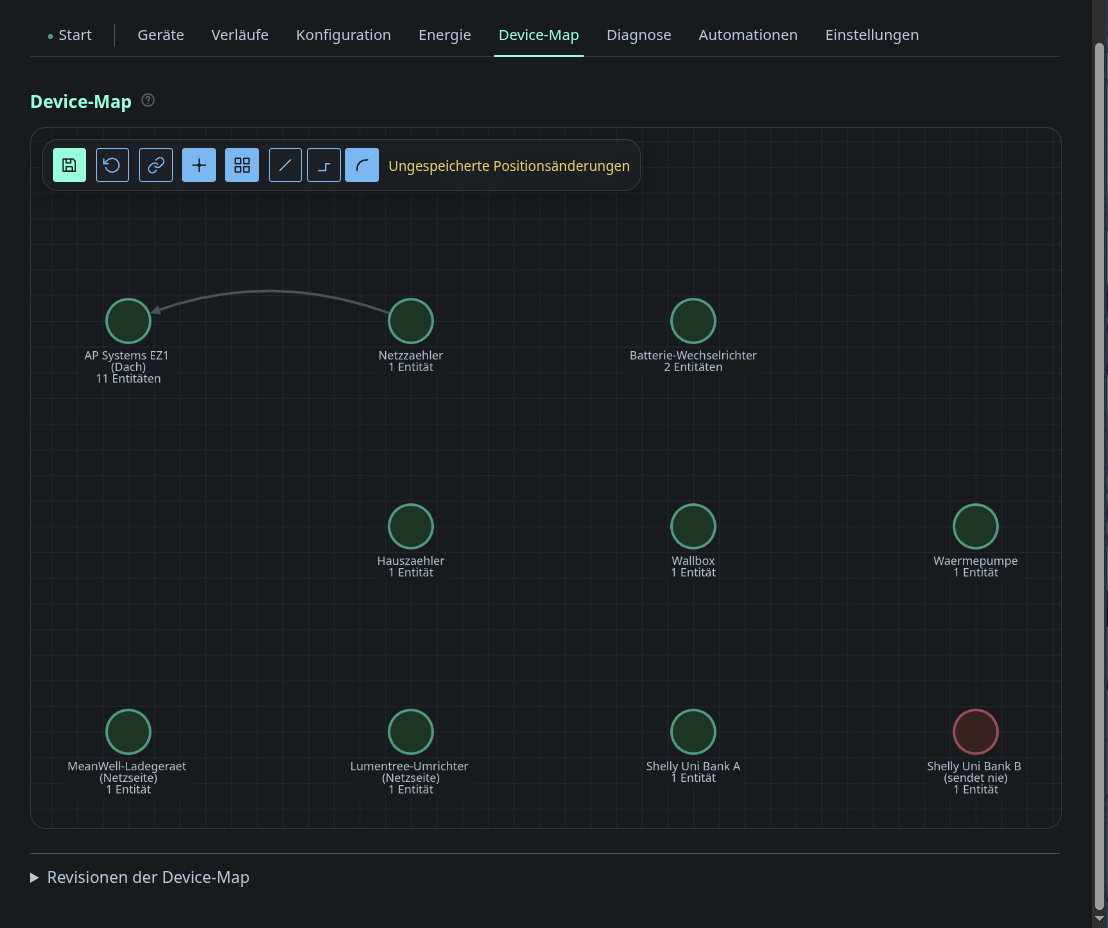
Device map layers, role rings and focus
The layer bar switches between Wiring, Live energy, Data flow and Roles. The view belongs to this browser, and Save as default writes it into the map for every browser.
More in Device map
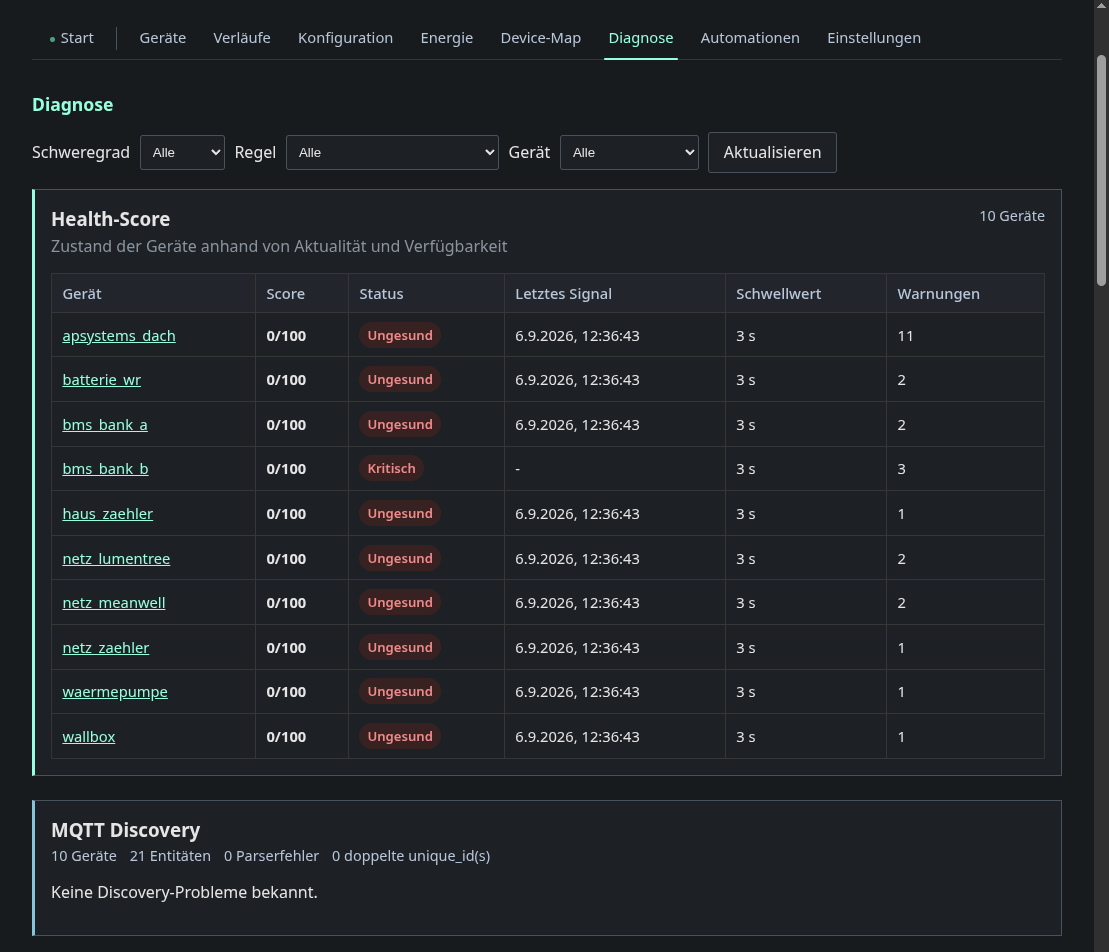
Redesign the diagnostics tab
The diagnostics page sums up the state in one line, counts the discovery devices and lists the findings with the affected devices.
More in Diagnostics
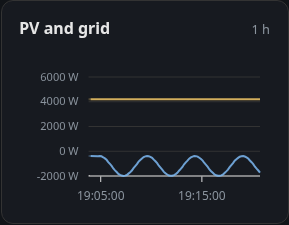
Add history view tiles to the overview layout
The History card shows a chart from the history page. Its options choose the source, the period, the statistic and the series.
More in Overview cards
Show the config service status as a pill
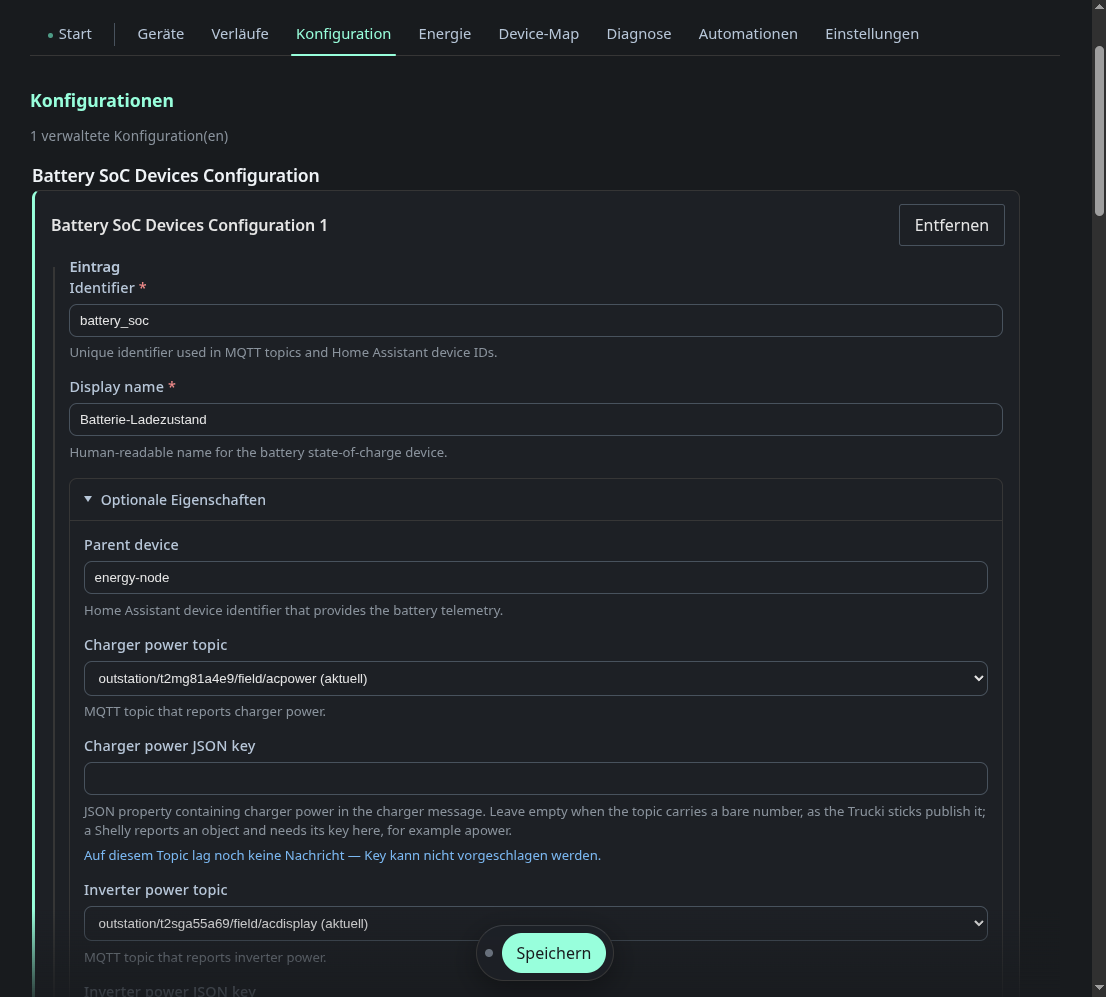
After saving, the service reloads its file. If it refuses the new file, it keeps the old one and the status pill says so.
More in Configuration editor
Custom energy categories in automations and editor polish
- Your categories in rules A threshold can watch your custom categories from the energy page. The field selection lists them under Custom categories.
Reorganise the device icon catalogue
- Pick a tile Every device has a tile. Details opens the device, and there you choose its icon.
- Icon catalogue The icons you can choose for a device are now sorted into categories, and there are more variants.
9 more changes in v0.9.0
- Settings polish and local docs serve Dashboard · #112
- Polish the device map and the energy tab Dashboard · #111
- Live plant view on the energy tab Dashboard · #110
- Data flow and balance layers on the device map Dashboard, Automation, Battery SoC · #109
- Edit energy roles on the device map Dashboard · #107
- Live energy flow on the device map Dashboard · #105
- Skip unchanged update steps and keep the session across the restart Dashboard, Bootstrap, Installer · #102
- Make saving the system configuration work and report it properly Dashboard · #91
- Check and install system package updates (opt-out) Dashboard, Bootstrap, Installer, Installer web UI · #90
v0.8.5 4 Oct 2026
The changelog pages open on the highlights, the switch at the top shows everything
- Highlights first You can now filter the highlights out of the changes.
2 more changes in v0.8.5
v0.8.3 1 Oct 2026
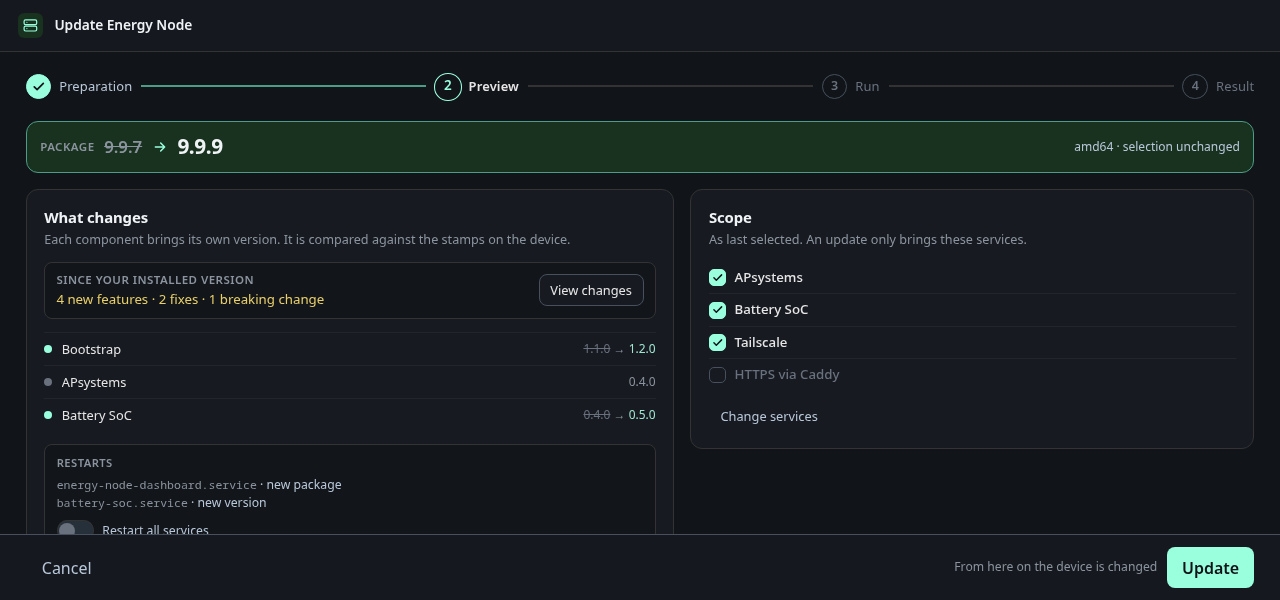
Ship changelog.json in the bundle and show what is new before an update
The update page lists the changes of the new package. The preview also shows which components change and which services restart.
More in Settings: Versions & updates
5 more changes in v0.8.3
- Rest the battery flow icon on its fill level at 0 W Dashboard · #81
- Keep the changed service selection in the update preview Installer, Installer web UI · #80
- Transfer only changed bundle files to the node Bootstrap, Installer, Installer web UI · #79
- Save the state on an interval and recover after a crash Dashboard, Battery SoC, Service common library · #78
- Break down versions per service in preview and diagnostics Bootstrap, Installer, Installer web UI · #76
v0.8.0 29 Sep 2026
Show installed component versions under settings
The Versions page shows the installed package and every component with its version. A service that is not installed is marked as such.
More in Settings: Versions & updates
Weekdays in the editor and a sun_window condition
In the rule editor a time window takes weekdays, and the sun window follows sunrise and sunset at the location from the settings.
More in Automations: Single rules
Localization foundation with language switcher
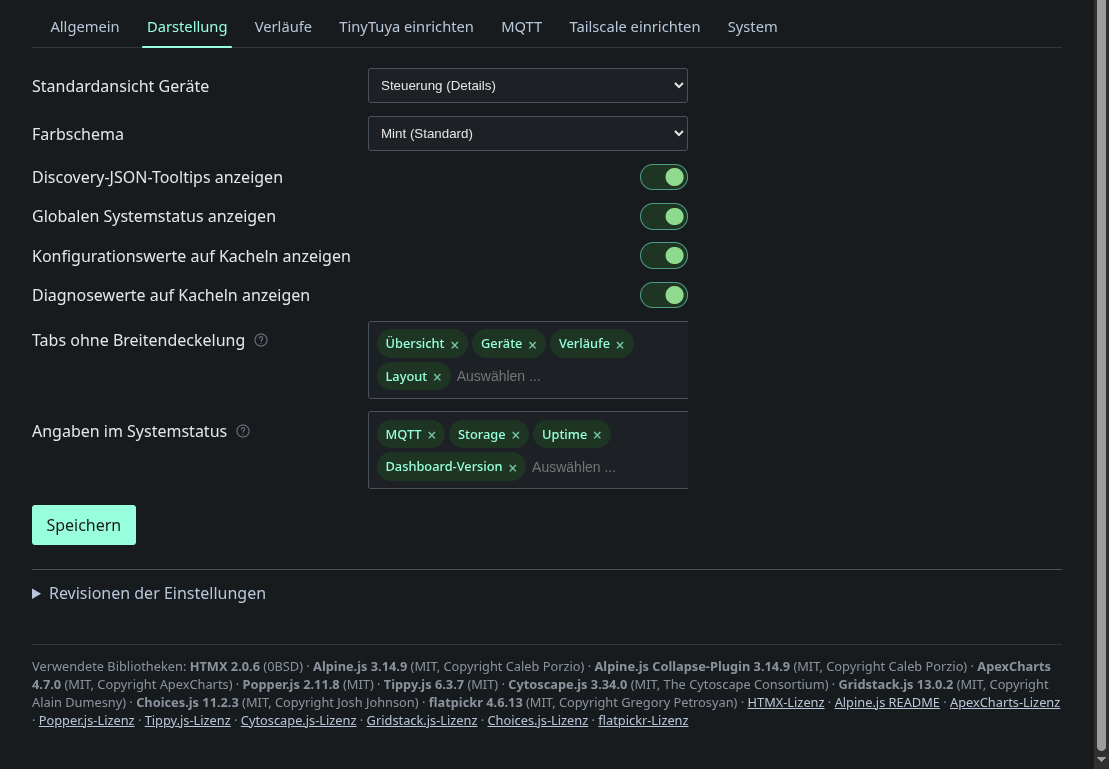
The Formatting card on the Appearance page holds the language of this browser, the switch for the DE | EN pill and the number format. Every text of the dashboard, its error messages and the update screen follow the language.
More in Settings: Appearance
DC-only systems in the MQTT service and conditional config forms
The form is generated from the schema of each service. Fields that depend on another choice appear only with that choice, and values are checked before anything is saved.
More in Configuration editor
Per-device icons and pinned favourite entities
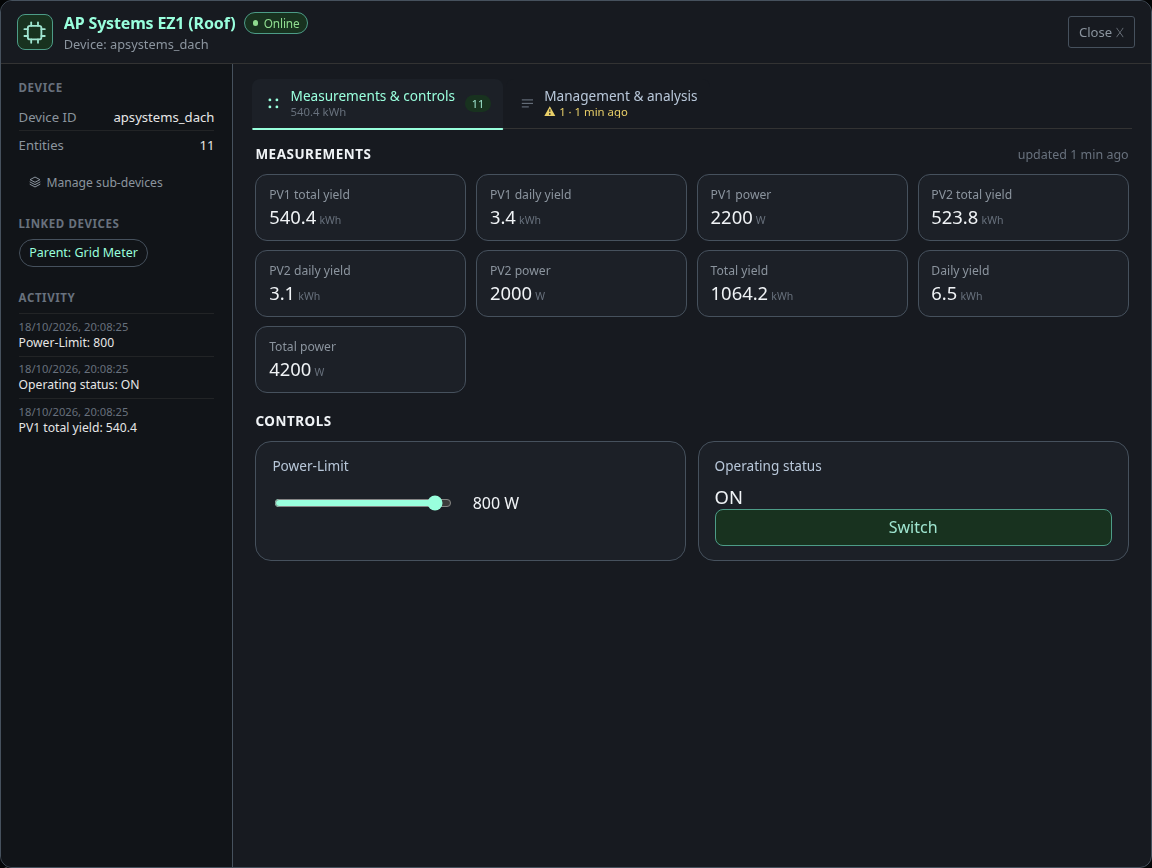
The device dialog shows the favourites at the top, up to three entities with their live values. Click the icon in the header to pick another icon from the catalogue.
More in Device dialog
17 more changes in v0.8.0
- Show the redeploy screen in the dashboard language Dashboard, Installer web UI · #74
- Localize the device configuration forms Dashboard, Automation, Battery SoC, Trucki · #73
- Localize the system configuration form Dashboard, APsystems EZ1, Automation, Battery SoC, Shelly, Trucki, Tuya, Service common library · #72
- Localize validation errors and diagnostics Dashboard · #70
- Localize API error messages Dashboard · #69
- Localize automations and history, guard every UI text Dashboard · #68
- Localize configuration and the layout editor Dashboard · #67
- Localize energy and settings Dashboard · #64
- Localize the shell and the overview Dashboard · #62
- A number format setting, with dates that follow the language Dashboard · #60
- Support DC-only systems and current sensors in HA Battery SoC, Battery SoC Core · #56
- The developer CLI replaces the old deploy script Installer · #55
- Ship the dashboard's device icons as an HA icon set Dashboard · #54
- A running update stays visible when the dashboard restarts itself Dashboard, Installer web UI · #52
- The redeploy preview shows service fields and previous versions Dashboard · #51
- Validate the MQTT service's sources with coded errors Battery SoC · #
- Remove scripts/deploy in favour of the installer CLI Installer · #
Automations · Battery SoC · Configuration editor · Dashboard · Device map · Devices · Diagnostics · Energy · Energy Node Companion · First-time setup · History · Installer · Overview & layout editor · Settings · Statistics · Updates · Users and permissions
Automations
-
The history can now be shown below the timeline as a detailed history. Details and test runs can be traced there as wellnext release
- Detailed history The history can now be shown below the timeline as a detailed history. Details and test runs can be traced there as well.
-
Automation windows can be limited to days of the monthsince v0.11.0
In the editor, time and sun windows have the collapsible section “Advanced: days of the month”. There you pick days from 1 to 31. The day the window starts counts, as with the weekdays.
- New assistant templates for heat pumps, low tariff charging and §14a control since v0.11.0
-
The zero feed template sets the regulator target with a draggable bandsince v0.11.0
The template asks “How tight should it regulate?”. You move the window by dragging, tapping or with the arrow keys, or you pick one of the cards Tight, Balanced and Careful. With “Adjust tolerance” you also drag the width of the band. The bars show yesterday's spread of the grid power, moved to the new target.
-
Rules show their last four triggers, and phones open the assistant as a sheetsince v0.11.0
When you open a rule on the Automations page, a strip shows its last four triggers. On a phone the assistant opens as a sheet at the bottom that you drag down to close.
-
An assistant builds scenarios and rules from five templates like zero feed-insince v0.11.0
You open it on the Automations page with “Assistant”. It shows the templates that fit your devices and names the missing device for the others. “Without a template” creates an empty rule or scenario.
- Editors show devices as tiles with live values in one device picker since v0.11.0
-
Scenarios with live cards, charts and a phase editor, plus a new rule editorsince v0.11.0
A scenario has three phases. Start holds the conditions that begin it, While is what happens during the scenario and End holds the actions when it stops. The usual use is a regulator that keeps the grid balance near a target.
More in Automations: Scenarios
-
Automation rules can repeat their actions while their conditions holdsince v0.11.0
The rule editor has the field “Repeat every (s)” for this. While all conditions hold, the rule sends its actions again at this interval. 0 means once per trigger. Repeat does not work with a toggle action.
-
Weekdays in the editor and a sun_window conditionsince v0.8.0
In the rule editor a time window takes weekdays, and the sun window follows sunrise and sunset at the location from the settings.
More in Automations: Single rules
Battery SoC
-
Calibration and tuning notes follow the dashboard languagesince v0.11.0
The notes under Calibration and tuning now appear in the language of the dashboard, before they always came in German. Home Assistant shows them in its own language.
- Save the state on an interval and recover after a crash since v0.8.3
- Support DC-only systems and current sensors in HA since v0.8.0
- Validate the MQTT service's sources with coded errors since v0.8.0
Configuration editor
-
Show the config service status as a pillsince v0.9.0
After saving, the service reloads its file. If it refuses the new file, it keeps the old one and the status pill says so.
More in Configuration editor
-
DC-only systems in the MQTT service and conditional config formssince v0.8.0
The form is generated from the schema of each service. Fields that depend on another choice appear only with that choice, and values are checked before anything is saved.
More in Configuration editor
Dashboard
- Scale the statistics card chart with the card height next release
- Animate updated values on the diagnostics page next release
- The dashboard starts and stays reachable when the first MQTT connection fails since v0.11.0
-
Onboarding bar, spotlight and checklistsince v0.11.0
- Set up and explore From now on the checklist shows what there is to discover after every update. It also offers a first setup, which you can still do later.
- Guided tours A guided tour like this one shows you where to find the new features.
- Catch up on tours You can also catch up on older tours if you want to discover what you might have missed.
-
Redesign the login card and link the faviconsince v0.11.0
The sign-in card has a new design. A bug with the favicon is also fixed.
- The main tab's More list no longer keeps resizing itself since v0.11.0
-
Redesign the toast with glass, timer line and swipe to dismisssince v0.11.0
The line at the bottom shows how long a toast stays. While the pointer rests on it, the time stops. Swiping right closes the toast. Every message disappears on its own, warnings and critical messages stay longer.
- Options for the energy statistics card since v0.10.0
- Settings in card layout and aligned panel headings since v0.10.0
- Device tiles update live without reloading since v0.10.0
- The statistics tile updates live in place since v0.10.0
- Hourly energy statistics from Home Assistant via the companion since v0.10.0
- Hourly energy statistics recorded on the server since v0.9.8
- Exchange history only on demand since v0.9.8
- Serve the automation history in full since v0.9.8
-
Custom energy categories in automations and editor polishsince v0.9.0
- Your categories in rules A threshold can watch your custom categories from the energy page. The field selection lists them under Custom categories.
-
Reorganise the device icon cataloguesince v0.9.0
- Pick a tile Every device has a tile. Details opens the device, and there you choose its icon.
- Icon catalogue The icons you can choose for a device are now sorted into categories, and there are more variants.
- Settings polish and local docs serve since v0.9.0
- Polish the device map and the energy tab since v0.9.0
- Live plant view on the energy tab since v0.9.0
- Data flow and balance layers on the device map since v0.9.0
- Edit energy roles on the device map since v0.9.0
- Live energy flow on the device map since v0.9.0
- Make saving the system configuration work and report it properly since v0.9.0
- Add Energy Node Companion as a history exchange peer since v0.8.5
- Rest the battery flow icon on its fill level at 0 W since v0.8.3
- Localize the device configuration forms since v0.8.0
- Localize the system configuration form since v0.8.0
- Localize validation errors and diagnostics since v0.8.0
- Localize API error messages since v0.8.0
- Localize automations and history, guard every UI text since v0.8.0
- Localize configuration and the layout editor since v0.8.0
- Localize energy and settings since v0.8.0
- Localize the shell and the overview since v0.8.0
- A number format setting, with dates that follow the language since v0.8.0
- Ship the dashboard's device icons as an HA icon set since v0.8.0
- The redeploy preview shows service fields and previous versions since v0.8.0
Device map
-
The device map can hide connections by type (energy, data, info) with a new filter buttonsince v0.10.8
The filter button next to the display menu hides energy, data or informational connections and the lines to the automation node, with one switch per type. It only changes what this browser draws.
More in Device map
-
Single appliances on a meter can be named as sub-devices in the device mapsince v0.10.0
Name single appliances on a meter as sub-devices. They appear in the device map, in the device dialog and on the energy page, so a washing machine behind a plug gets its own place.
More in Device map
-
Switches are an energy role with an optional channel, shown as green or redsince v0.10.0
A switch is now an energy role with an optional channel. Every switched connection shows a green or red circle, and only the connection on a switched off channel is cut. The channel of a connection is chosen in its card.
More in Device map
-
The device map shows switched-off devices, which fade out with an off labelsince v0.10.0
The device map marks every device without power as off and fades it out. A switched off output cuts the connection behind it.
More in Device map
- Connections show their flow direction and can be reversed by hand since v0.9.8
- The automation device sits under the node, with its rules linked to it since v0.9.8
-
The balance node is merged into the energy_node devicesince v0.9.8
The Energy Node is the balance itself, the device the dashboard publishes for Home Assistant. It shows the net grid power, and the Roles layer connects every device with an energy role to it.
More in Device map
-
Device map layers, role rings and focussince v0.9.0
The layer bar switches between Wiring, Live energy, Data flow and Roles. The view belongs to this browser, and Save as default writes it into the map for every browser.
More in Device map
Devices
-
Star favourites and an Analysis tab that lists warnings and every entitysince v0.11.0
The Analysis tab lists the warnings and every entity of the device with its topic, its last message and the commands sent to it. It needs the right to see the device analysis, and choosing favourites needs the right to style devices.
More in Device dialog
- The device map shows the right edge of its canvas again since v0.10.0
-
Per-device icons and pinned favourite entitiessince v0.8.0
The device dialog shows the favourites at the top, up to three entities with their live values. Click the icon in the header to pick another icon from the catalogue.
More in Device dialog
Diagnostics
-
The diagnostics page shows Energy Node service logs with search and refreshsince v0.10.8
The Service logs section on the diagnostics page shows the journal of one service at a time. Choose the service, the time range and the number of lines, search the loaded lines and turn on Refresh automatically to see new lines every 5 seconds. It needs the system_actions role.
More in Diagnostics
- Use a working health threshold since v0.10.8
-
Redesign the diagnostics tabsince v0.9.0
The diagnostics page sums up the state in one line, counts the discovery devices and lists the findings with the affected devices.
More in Diagnostics
Energy
- Hide only role-less entries and share the list with the device map since v0.10.0
-
House load is always calculated, with a house meter as cross-checksince v0.10.0
House consumption is now always calculated from the balance. A house meter serves as a cross check and replaces the calculation only when no grid role is assigned. A line below the modes shows where the value comes from and how far the meter deviates.
More in Energy
-
Energy groups and custom categoriessince v0.9.0
A group bundles devices without a meter of their own. With Count as a whole on, it counts in one consumer category, which you pick or create in place. Custom categories add your own consumer, producer or storage types.
More in Energy
Energy Node Companion
-
Named accounts with own permissions, a minimum password length and sessionssince v0.11.0
Home Assistant users sign in through the Energy Node Companion integration. From version 0.4.0 it pairs with the dashboard through a pairing code from the Home Assistant card on the Users page. The guide links to the integration on GitHub.
First-time setup
- Tours can run actions, include guest and favourite steps, and offer news since v0.11.0
-
Every feature since v0.8.0 has a tour, and older releases can catch upsince v0.11.0
Every visible feature since version 0.8.0 has a tour. Releases older than the last three minor versions open step by step under Explore further back. On every older release card, Take the tour plays all tours of that release. Once all are seen, the button reads Repeat tour.
-
The checklist's Explore mode lists the highlights of the last three releasessince v0.11.0
Under Settings, Checklist you find the Explore mode. It lists the highlights of the last three minor versions, one card per release. Highlights with a tour walk you through the change on the real pages, the others show their description.
-
A guided first-time setup for admins covers access, display, system and devicessince v0.11.0
As an admin, a bar at the bottom walks you through the real settings pages, and a spotlight marks the setting of each step. What an existing install already has set is checked off, and you can put off any step with “Later”. Anything still open is in the checklist afterwards. Guests see a note until the setup is finished.
History
- Stop exchange requests for the 1h resolution next release
-
The history page offers fitting resolutions in a dropdown and a 3 month presetsince v0.10.0
The first pill above the chart lists the resolutions that fit the chosen span and shows how much of it each one covers. The automatic choice is the coarsest resolution that has data. A week or longer shows hourly values from the energy statistics, and there is a quick choice for 3 months.
More in History
Installer
- Apply the installer admin name and detect more setup steps as done since v0.11.0
-
The installer detects a refused MQTT login and repairs it with a new passwordsince v0.11.0
If the broker rejects the password, the diagnostics show the MQTT login check as failed. The repair opens the dialog “Set a new MQTT password”, where you enter a new password or create one with “Random password”. The node and the broker then both receive it.
-
The installer diagnose shows a live log of the dashboard and the updatersince v0.11.0
The Live log card in the diagnostics follows the dashboard and the updater, so you can find out without SSH why the dashboard does not start. Under “Lines in report” you choose how many lines the report takes along. “Copy for issue” copies it for a GitHub issue, with addresses, names and passwords masked.
-
Skip recommended apt packages and clean the package cachesince v0.11.0
The installer no longer loads recommended extra packages. That keeps about 400 MB of compilers the device does not need off it. After the apt steps it deletes the downloaded package files, so small SD cards do not fill up.
- A fresh install starts the dashboard despite a missing folder or MQTT login since v0.11.0
-
The installer's Dashboard step presets users, guest access and the looksince v0.11.0
The Dashboard step sits between Configuration and Run. There you preset users, guest access and the look, or choose “Configure later”. The dashboard takes the presets over at its first start, and the setup checklist then shows them as “Set in the installer”.
More in Deploying a node
-
The installer can load Python packages online when the versions do not matchsince v0.11.0
If the device's Python version does not match the package, the preparation stops with “Process paused, confirmation required”. With “Load dependencies online” the installer loads the remaining dependencies from the internet. The device needs internet access for this.
More in Deploying a node
-
A dialog asks for the sudo password and sets up passwordless sudosince v0.11.0
If you connect with a key file and sudo on the device asks for a password, the pre-check opens the dialog “sudo password needed”. With “Allow sudo” the installer sets up passwordless sudo for your user. The password is not stored and appears in no log.
More in Deploying a node
-
Home Assistant users sign in through the Energy Node Companionsince v0.11.0
Under Settings, Users you create a pairing code in the Home Assistant section. You enter it in Home Assistant under Settings, Devices and services, Energy Node Companion, Configure. After that the panel in Home Assistant shows the dashboard as the signed-in Home Assistant user. You set their rights through the presets HA administrators and HA users.
More in Settings: Users
- Clearer update notice, firewall step completes, unchanged libraries skipped since v0.10.8
- Help texts, device map, energy roles and statistics fit narrow screens since v0.10.0
-
Choose how many changelog versions show, kept on the device across updatessince v0.10.0
The setting Versions in the changelog sits on the Versions tab. Last 5 is the default and Last 20 is the most a bundle carries. All also shows the older versions the node kept from earlier updates.
More in Settings: Versions & updates
-
Release highlights also come in German, shown in the dashboard and installersince v0.10.0
Release highlights carry a German text next to the English one. The dashboard shows the text in its language, and so do the installer and the release notes on GitHub.
More in Settings: Versions & updates
- The update result screen fits the dashboard since v0.10.0
- Show update progress and what's new after an update since v0.9.8
- List every step and service as its own run station since v0.9.8
- Skip unchanged update steps and keep the session across the restart since v0.9.0
- Check and install system package updates (opt-out) since v0.9.0
-
The changelog pages open on the highlights, the switch at the top shows everythingsince v0.8.5
- Highlights first You can now filter the highlights out of the changes.
- Remember the access details in the OS keychain since v0.8.5
-
Ship changelog.json in the bundle and show what is new before an updatesince v0.8.3
The update page lists the changes of the new package. The preview also shows which components change and which services restart.
More in Settings: Versions & updates
- Keep the changed service selection in the update preview since v0.8.3
- Transfer only changed bundle files to the node since v0.8.3
- Break down versions per service in preview and diagnostics since v0.8.3
- Show the redeploy screen in the dashboard language since v0.8.0
-
Show installed component versions under settingssince v0.8.0
The Versions page shows the installed package and every component with its version. A service that is not installed is marked as such.
More in Settings: Versions & updates
- The developer CLI replaces the old deploy script since v0.8.0
- A running update stays visible when the dashboard restarts itself since v0.8.0
- Remove scripts/deploy in favour of the installer CLI since v0.8.0
Overview & layout editor
-
Add history view tiles to the overview layoutsince v0.9.0
The History card shows a chart from the history page. Its options choose the source, the period, the statistic and the series.
More in Overview cards
Settings
-
Guests can only view by default, and an admin can switch guest access offsince v0.11.0
Guests may only view by default. An admin can switch guest access off in the guest card of user management. The sign-in page then no longer offers guest access, and running guest sessions end.
More in Settings: Users
-
Install the offered update from the update barsince v0.11.0
When a newer release is out, the bar under the header offers it. Install now asks once more and then updates right away. Prepare installation opens the installer page.
More in Settings: Versions & updates
-
Users only see and change the pages their permissions allowsince v0.11.0
You set permissions under Settings, Users. The settings permission is now split into “Change the appearance” and “Set up the dashboard”. Existing accounts keep what they were allowed to do. An account without a view permission sees only a notice and its own account.
More in Settings: Users
-
The dashboard title and subtitle can be changed or hiddensince v0.10.8
The Masthead card on the Appearance page sets the title and subtitle at the top of every page. An empty field keeps the default text, and each line can be hidden. The title also names the browser tab and the sign-in page.
More in Settings: Appearance
-
Settings pages are listed in a sidebar, on phones in a sheet from the bottomsince v0.10.8
The settings pages sit in a sidebar, each with an icon and a short description. On a phone a button above the content shows the current page and opens the full list as a sheet from the bottom.
More in Settings
-
Home Assistant gets sensors for wallbox, heat pump and custom categoriessince v0.10.0
Additional sensors offers House load measured, House load calculated and one sensor per wallbox, heat pump and custom category. All are on by default. Deselect one and the dashboard removes it from Home Assistant, select it again to bring it back.
More in Settings: MQTT
-
The MQTT tab explains the Mosquitto bridge and picks system metrics in one listsince v0.10.0
System metrics such as Wi-Fi signal or undervoltage are published as diagnostic entities. Remove a metric from the selection to stop publishing it and add it again to resume. Changes are saved at once and need a login with configuration rights over HTTPS.
More in Settings: MQTT
-
Show exchange and history status as tilessince v0.9.8
The History page of the settings switches the exchange between devices and chooses when this browser exchanges. Below the choices a status tile shows whether the exchange is connected and how many values it added.
More in Settings: History
-
Localization foundation with language switchersince v0.8.0
The Formatting card on the Appearance page holds the language of this browser, the switch for the DE | EN pill and the number format. Every text of the dashboard, its error messages and the update screen follow the language.
More in Settings: Appearance
Statistics
-
The statistics page works on a phone, with a table or grid viewsince v0.11.0
On narrow screens the statistics page shows a table of intervals or a grid, and the period sits in a pill at the bottom.
More in Energy statistics
-
Energy statistics tile, page and recording modesince v0.10.0
The Statistics tab shows consumption, PV yield, grid import, feed-in and the battery flows for a day, week, month or year. The node records the hours itself, and with the companion the hours from Home Assistant replace them. A tile with the same figures is available for the overview.
More in Energy statistics
Updates
- Expandable highlight details in the what's new dialog since v0.10.0
Users and permissions
- Log restricted logins and reject password changes of HA accounts since v0.11.0